
These original exercises are practice, not predicted exam images. They train the transferable skill: identify the visual, select its main pattern, support that pattern with accurate details and close clearly.
Academic and Core currently give 25 seconds to study a Describe Image prompt and 40 seconds to speak. Pearson Academic speaking tips, January 2026 Pearson Core format
Practice 1: household energy
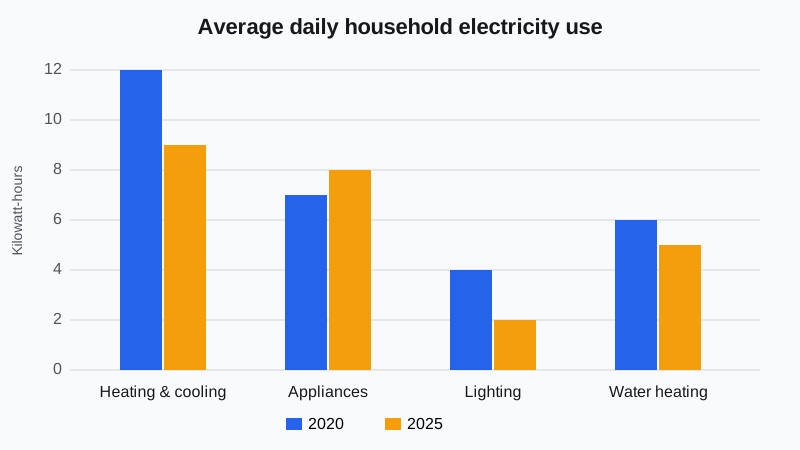
The table represents a bar chart showing average daily household electricity use in kilowatt-hours.
| Use | 2020 | 2025 |
|---|---|---|
| Heating and cooling | 12 | 9 |
| Appliances | 7 | 8 |
| Lighting | 4 | 2 |
| Water heating | 6 | 5 |
Model: The bar chart compares average household electricity use across four purposes in 2020 and 2025. Heating and cooling remained the largest category, although it fell from twelve to nine kilowatt-hours. Appliance use was the only category to rise, increasing from seven to eight. Lighting recorded the largest proportional decline, halving from four to two. Overall, total use decreased despite the small increase for appliances.
Why it works: The answer gives an overview, two strong comparisons and accurate units. It does not read every number.
Practice 2: library visits
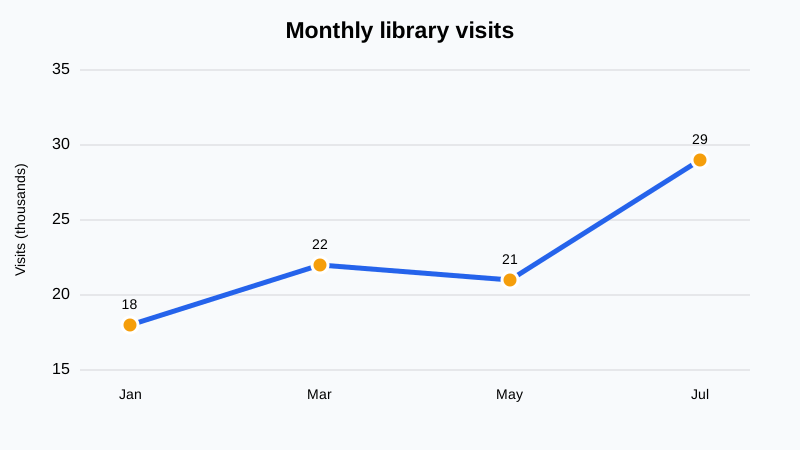
The data represents a line chart of monthly visits, in thousands.
| Month | Jan | Mar | May | Jul |
|---|---|---|---|---|
| Visits | 18 | 22 | 21 | 29 |
Model: The line chart shows library visits from January to July, measured in thousands. Visits rose from eighteen thousand in January to twenty-two thousand in March, then slipped slightly to twenty-one thousand in May. The strongest growth occurred by July, when visits reached twenty-nine thousand. Overall, the trend was upward, despite a small decline in the middle of the period.
Practice 3: simple process
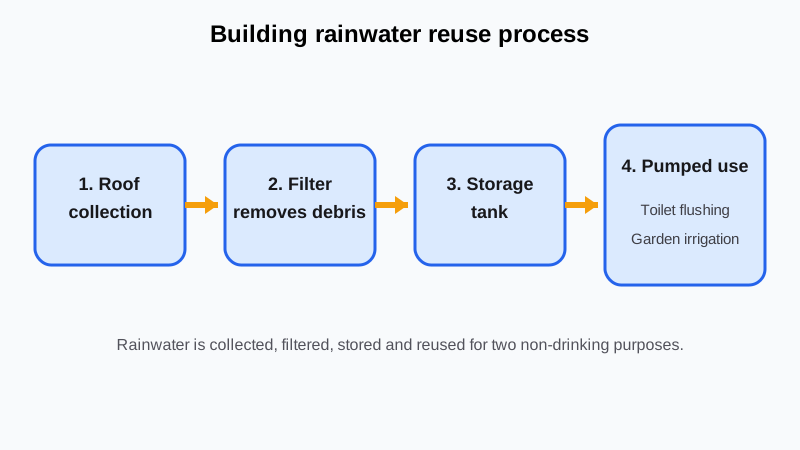
Diagram description: Rainwater falls onto a roof, moves through a filter into a storage tank, is pumped into a building, and is used for toilets and garden irrigation.
Model: The process diagram shows how a building collects and reuses rainwater. First, rain falls onto the roof and flows through a filter, which is labelled as removing debris. The cleaned water enters a storage tank and is later pumped back into the building. It is used for toilet flushing and garden irrigation rather than drinking. Overall, the system captures, stores and redirects rainwater for two non-drinking purposes.
Review each recording
Check visual type, main pattern, factual accuracy, comparisons and a clear close. Remove invented causes. A structure cannot guarantee a score, and generic statements unrelated to the image can weaken content.
For the reusable method, read PTE Describe Image Template. Use these four exercises, then browse Describe Image practice.
Practice 4: choose, do not list
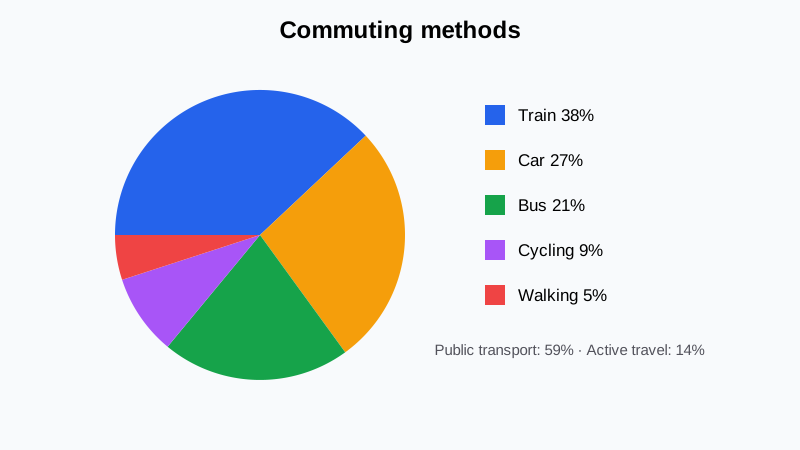
A fictional pie chart shows commuting methods: train 38%, car 27%, bus 21%, cycling 9% and walking 5%.
Plan only this: train leads; public transport totals 59%; active travel is smallest at 14%. A useful response compares groups instead of reciting five labels. Record once, check every figure against the prompt, then record a new chart. Do not polish the same answer until memory hides the selection problem.